Contents
Previous
Next

Multi-mission x-ray analysis software system
Version : 2.5.1
Author(s) : (rsdc@cfa.harvard.edu)
License : AURA
Website :
http://hea-www.harvard.edu/PROS/pros.html
Disk space required for installation is 126.41 Mb
The following printable documents will be installed :
Summary
PROS/XRAY is a multi-mission x-ray analysis software system designed to
run under the Image Reduction and Analysis Facility (IRAF).
The analysis of x-ray data differs from that of other wavelengths
due to the nature of x-ray data. The scarcity of data, the low
signal-to-noise ratio and the large gaps in exposure time make
data screening and masking an important part of the analysis
process.
The PROS software includes spatial, spectral, timing, data I/O and
conversion routines, plotting applications, and general algorithms for
performing arithmetic operations with imaging data.
A more complete description of PROS can be found in the PROS User's
GUIDE (PUG).
How PROS is organized
Programs in PROS are called tasks. Tasks are grouped by function
into packages. The major packages in PROS include:
xdataio - Tasks to convert data to/from FITS format
xplot - Plotting routines for XRAY data
ximages - Additions to IRAF images package
xspatial - X-ray spatial analysis package
xspectral - X-ray spectral analysis package
xtiming - X-ray timing analysis package
A diagram of the current package organization is available.
Brief Overview of PROS analysis tasks
tv display
Tasks display and xdisplay will produce a TV display of the data.
sky grids
The imcontour task calculates and graphs the iso-intensity areas of
the images and displays them on a skygrid.
coordinates
Support for the World Coordinate System (WCS) is provided in all
the IRAF and PROS tasks. PROS provides additional interfaces to
facilitate conversions, including
an interactive mode from the image display.
graphics
All non-image output data files from PROS analysis are produced in
TABLE format which can be graphed either with the TABLES sgraph task or
with the Interactive
Graphics Interpreter (igi).
source detection
The detect package is designed to perform Maximum Likelihood Source
detection on data exhibiting Poisson statistics. It uses a
signal-to-noise threshold calculation.
PRF modeling
The imcalc, immodel and imsmooth tasks provide the ability to
generate complex Point Response Function model images that can be
convolved with observations.
data extraction
The imcnts task is a utilitarian tool used to extract background
subtracted counts from complex regions.
timing corrections
The timcor package provides the conversions from spacecraft clock
to UTC and calculation of the barycenter timing correction.
periodic analysis
The tasks ltcurv and fft provide general capabilities to examine
periodic data. The period and fold tasks include a provision for a
decaying period. The qpphase task
generates a QPOE files with an additional event attribute, phase,
that then allows the data to be split according to phase.
spectrum extraction
The qpspec task allows users to extract a background corrected
spectrum from a QPOE file for use in PROS or for export to other
analysis systems.
model specification and fitting
PROS has a flexible spectral model specification language which
allows multi-component model fitting. Also, the fit task allows fitting
of multiple data sets.
flux conversion
Fluxes for any object can be calculated from the xflux task.
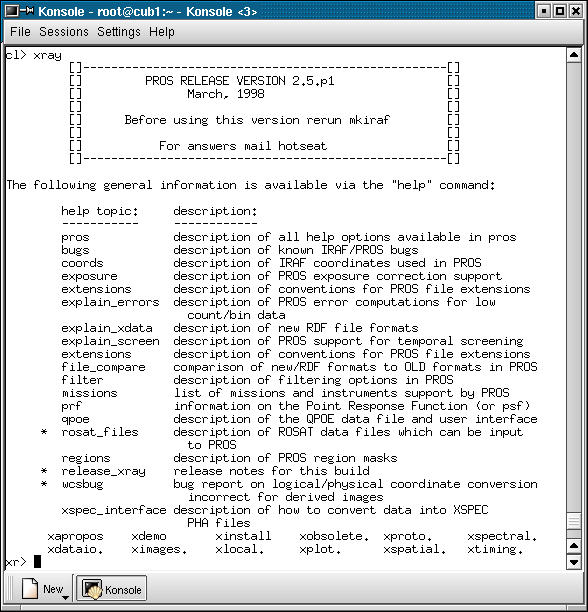
Screenshots

Contents
Previous
Next

